
Covid-19 Pandemic: Effects of Containment Policy and Vaccination
An Agent-Based Modelling Using Netlogo

Covid-19 Pandemic
Simulation Using Netlogo
Introduction
The COVID-19 pandemic has gripped the world and resulted in widespread disruption, with over 346 million cases and 5.5 million deaths as of January 2022. To combat the spread of the virus, many countries have implemented various strategies, including lockdowns, social distancing, and the use of vaccines.
To address these challenges, a simulation using the SIR (Susceptible, Infected, and Recovered) model was developed to assess the impact of various containment and vaccination policies. The model incorporates data from the Philippines and simulates the spread of COVID-19 under different policy scenarios. The model takes into account several key variables, including the number of susceptible individuals, the number of infected individuals, and the number of recovered individuals. It also considers the impact of containment measures and vaccination programs.
The simulation model is used to explore the potential impact of different vaccination and containment strategies in the Philippines. The results show that a combination of vaccination, containment, and mass testing can be effective in limiting the spread of the virus. The simulation results can provide valuable insights for policymakers in the Philippines and other countries facing similar challenges. By understanding the potential impact of different strategies, countries can make informed decisions on how to best respond to the COVID-19 pandemic.
Theoritical Basis
The S-I-R model developed by Kermack and Mackendrick (1927) was modified by Eichenbaum, Rebelo, and Trabandt (2020). The simulation was inspired by Eichenbaum, Rebelo, and Trabandt (2020) model, with the difference of not taking into account the aggregate consumption and labor hours of the population. The S-I-R model operates in (i) the probability of getting infected (for those who are susceptible), (ii) the probability of recovering (recovery rate), and (iii) the probability of dying (fatality rate).
Equation 1, showing the Tₜ equation (new infections per period). The parameter π refer to the probability of getting infected.
Equation 1. 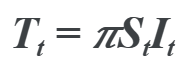
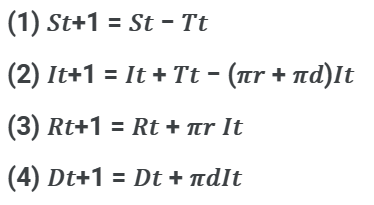
Borrowing the notations of Eichenbaum, Rebelo, and Trabandt (2020), we arrived at the following equations:
The containment policy or quarantine measures that people must follow can vary depending on the location and the specific circumstances. Generally speaking, quarantine involves isolating oneself from others in order to prevent the spread of disease. This may involve staying at home or in a designated quarantine facility for a certain period of time and avoiding contact with others. Quarantine measures may be mandatory or voluntary, and may be enforced by government authorities or self-imposed by individuals. The goal of quarantine measures is to slow down or stop the spread of disease and protect the health of the wider population.
Figure 1. Evolution of business restrictions/containment policies (maximum capacities at which businesses can operate) in NCR, Philippines
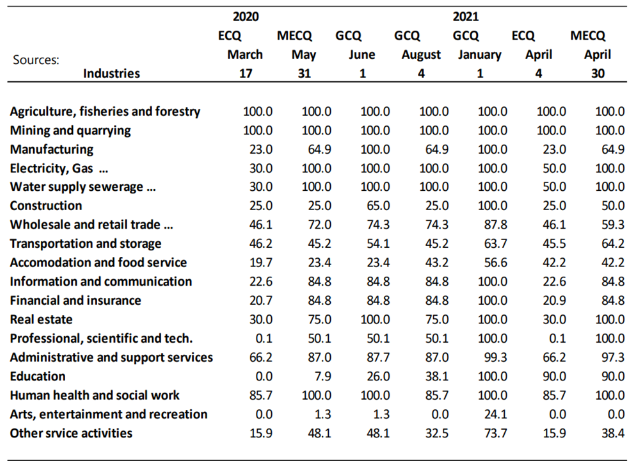
Source: Basilio’s estimates (preliminary) using PSA’s Annual Survey of Business Establishments, the PSIC and National Income Accounts, based also on government directives such as IATF Resolutions, DTI Circulars, LTFRB issuances, among others.
Equation 5. 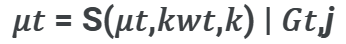
The variable μt,k represents the containment measure per industry k over time where k = 1, ..., 18, representing the 18 industries listed in the equation above. Information sets about containment policies over time and by industry are represented using the Gt,j notation.
Relating the containment rate, the parameter μt denotes the containment rate. And this simulation it is used to limit the movements of turtles. And we have a containment interval to account for the changes in the quarantine period.
For the theoretical basis of the vaccination program, as stated in Basilio’s paper, the utility maximization problem of the vulnerable individuals in Eichenbaum, Rebelo, and Trabandt's (2020) macroeconomic model of a pandemic reflects vaccination as shown in the equation below.
Equation 6. 
The period t utility that an individual derives through regular consumption and employment decisions or activities is represented by the first term of the equation. The second and third terms relate to potential health conditions for the sensitive person throughout the next period (t + 1). If the person does not get vaccinated (with a probability of δv), they will either continue to be susceptible or contract the disease. If the person is vaccinated, they join the group that has "recovered" or is “immune” since the vaccinated person never contracts the disease again, at least throughout the pandemic time.
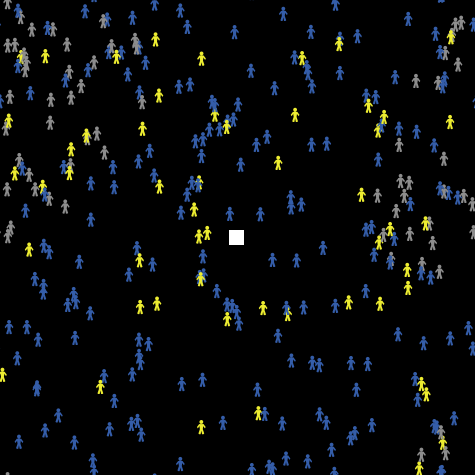
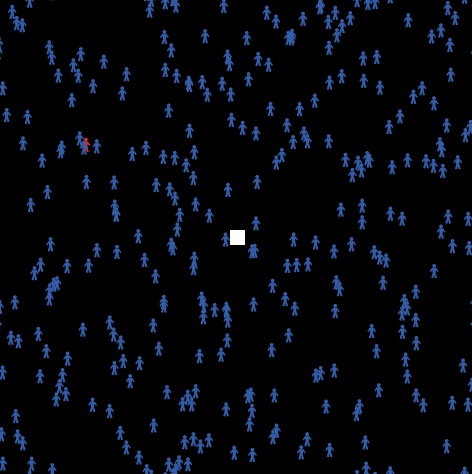
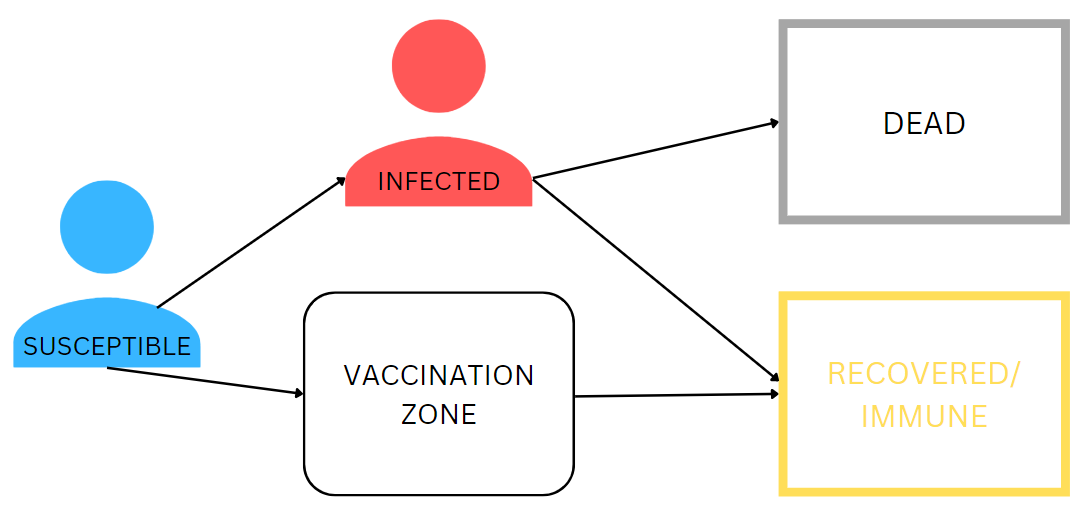
Inspired by this, we have this model for an S-I-R with a vaccination program where we consider the last term of equation 6. Our model as shown in Figure 2 below, shows that a susceptible will become immune if it passes through the vaccination zone or gets vaccinated. On the other hand if a susceptible will not get vaccinated but get close to the infected this will turn the susceptible to becoming infected and with the fatality-rate and recovery-rate will either be dead or immune.
Constants Used
The following are the constants or variables used in the model:
- population - the total number of people in the environment
- virus-duration - how many days an infected will still have the virus
- fatality-rate - the probability that an infected person will die
- recovery-rate - the probability that an infected person will recover
- containment-rate - the percentage of the people that are contained or quarantined
- containment-interval - the containment period
These constants will determine how the simulation will go, if more people will get infected and die, or get vaccinated, recover and reach immunity.
Netlogo Simulation
Test Settings
The Pandemic Agent-Based Model is developed through netlogo which is a multi-agent programmable modeling environment. To test the model the following parameters are observed:
- population - 300 people, to have more turtles within the environment
- virus-duration - 14 days, as it takes two weeks on average to recover according to a World Health Organization (WHO) analysis
- fatality-rate - 0.05, as according to the data stated on Basilio’s paper
- recovery-rate - 0.95, by subtracting 0.05 fatality-rate to 1
- containment-rate - 54%, based on Figure 1, March to May containment policy, where the average of the values is 53.8458823529 rounded to the nearest ones
- containment-interval - 76 days, based on Figure 1, on the number of days from March to May
There is also a switch for connection, if turned on will create a connection to the infected and the people they infected. Another switch is for vaccination-zone? In which if turned on will place a vaccination zone in the environment. The coordinates of the vaccination zone is dependent on the variable vaccination-x-coordinate and vaccination-y-coordinate in which in the test settings is set to 0, 0 to place it in the middle of the environment.
The setup button must also be clicked first to ‘setup’ the simulation, and click the ‘start’ button to start the simulation. The simulation will stop if all get infected or get immune.
These test settings will result in a small infection where only a small number of people will get infected resulting in a small number of deaths and more number of immune individuals. And when the containment-rate is set to zero, and vaccination-zone? it turns out there will be more people that get infected and that more death and less immunity. This just shows that vaccination and containment policy play a great role in mitigating the pandemic.
These parameters can be freely adjusted based on the relevant data or the observer's preference so feel free to try and experiment and enjoy the Pandemic ABM Netlogo.
Key Takeaways
This agent-based model (ABM) that examines the COVID-19 pandemic and includes containment policies and vaccination strategies can be incredibly informative in understanding disease transmission and control. Some key insights that can be drawn from this model include:
- · By implementing containment measures, such as community quarantine, in the early stages of an outbreak, the model demonstrates that it can significantly reduce the number of infections.
- · Through simulations, the model can show how vaccination campaigns can effectively lower the number of infections and deaths, especially when combined with other control measures.
- · Policymakers can use the model as a tool to evaluate different scenarios and interventions, allowing them to make informed decisions and allocate resources effectively during a pandemic.
References
[1] Basilio, J. R. (2021, June 18). The SIR (susceptible-infected-recovered) pandemic model and the Philippine’s quarantined economy. www.bsp.gov.ph. Retrieved March 1, 2023, from https://www.bsp.gov.ph/Pages/ABOUT%20THE%20BANK/Events/By%20Year/2021/BSP_Research_Fair/Day%201%20Paper%205__SIR%20and%20PH%20quarantine%20full%20paper_%20JBasilio.pdf
[2] Weekly epidemiological update on COVID-19 - 25 January 2022. (n.d.). Www.who.int. Retrieved April 19, 2023, from https://www.who.int/publications/m/item/weekly-epidemiological-update-on-covid-19---25-january-2022?fbclid=IwAR3cDu3R1ETakj45gBp6eFoabkvWAjsFfC0lkdOE1ku1O9ZvYOHTqznd5HM
[3] Gallagher, J. (2020, April 26). How long does it take to recover from coronavirus? BBC News. https://www.bbc.com/news/health-52301633
Webpage Layout, Images and Model
[Webpage Layout] Future Imperfect by HTML5 UP. (2015, November). Html5up.net. https://html5up.net/uploads/demos/future-imperfect/
[Webpage Layout] Otto, M. (2022). Bootstrap. Getbootstrap.com. https://getbootstrap.com/
[Model] NetLogo Home Page. (n.d.). Ccl.northwestern.edu. https://ccl.northwestern.edu/netlogo/
[Logo] Bing. (n.d.). Bing. Retrieved April 19, 2023, from https://www.bing.com/images/create/a-modern-logo-with-number-3-and-the-word-22trends22/643eb0626d2a421397e45e193ec691e4?id=HuivR9q6wldYDhYFXUM88g%3d%3d&view=detailv2&idpp=genimg&FORM=GCRIDP&ajaxhist=0&ajaxserp=0
[Pandemic Image] Caceres, V. (2020). What’s the Difference Between an Epidemic and Pandemic? US News & World Report; U.S. News & World Report. https://health.usnews.com/conditions/articles/whats-the-difference-between-an-epidemic-and-pandemic